

 Facebook
 X
 Pinterest
 Copy Link
1981 had brutal borrowing costs. 2008 had a crash. 2021 had cheap money and bidding wars. Every market asks you to give something up.
By Chris Eckerman · Associate Broker · Coldwell Banker Schmidt Realtors
Research checked October 7, 2026
“I’ll move when the housing market gets back to normal.” It sounds reasonable. Until you try to define normal.
Three percent mortgage rates? Lower prices? Plenty of homes to choose from? A buyer who pays your asking price without asking you to fix anything? That is a wish list. Getting every item at once is a different proposition.
Housing markets have ordinary stretches. But the version people remember as perfect usually leaves something out. The expensive loan. The job uncertainty. The sixth offer that went nowhere.
History is useful because it exposes those tradeoffs. It cannot tell you what next spring will bring. It can help you ask a better question: does a move make sense for your life, your finances, and the property in front of you?
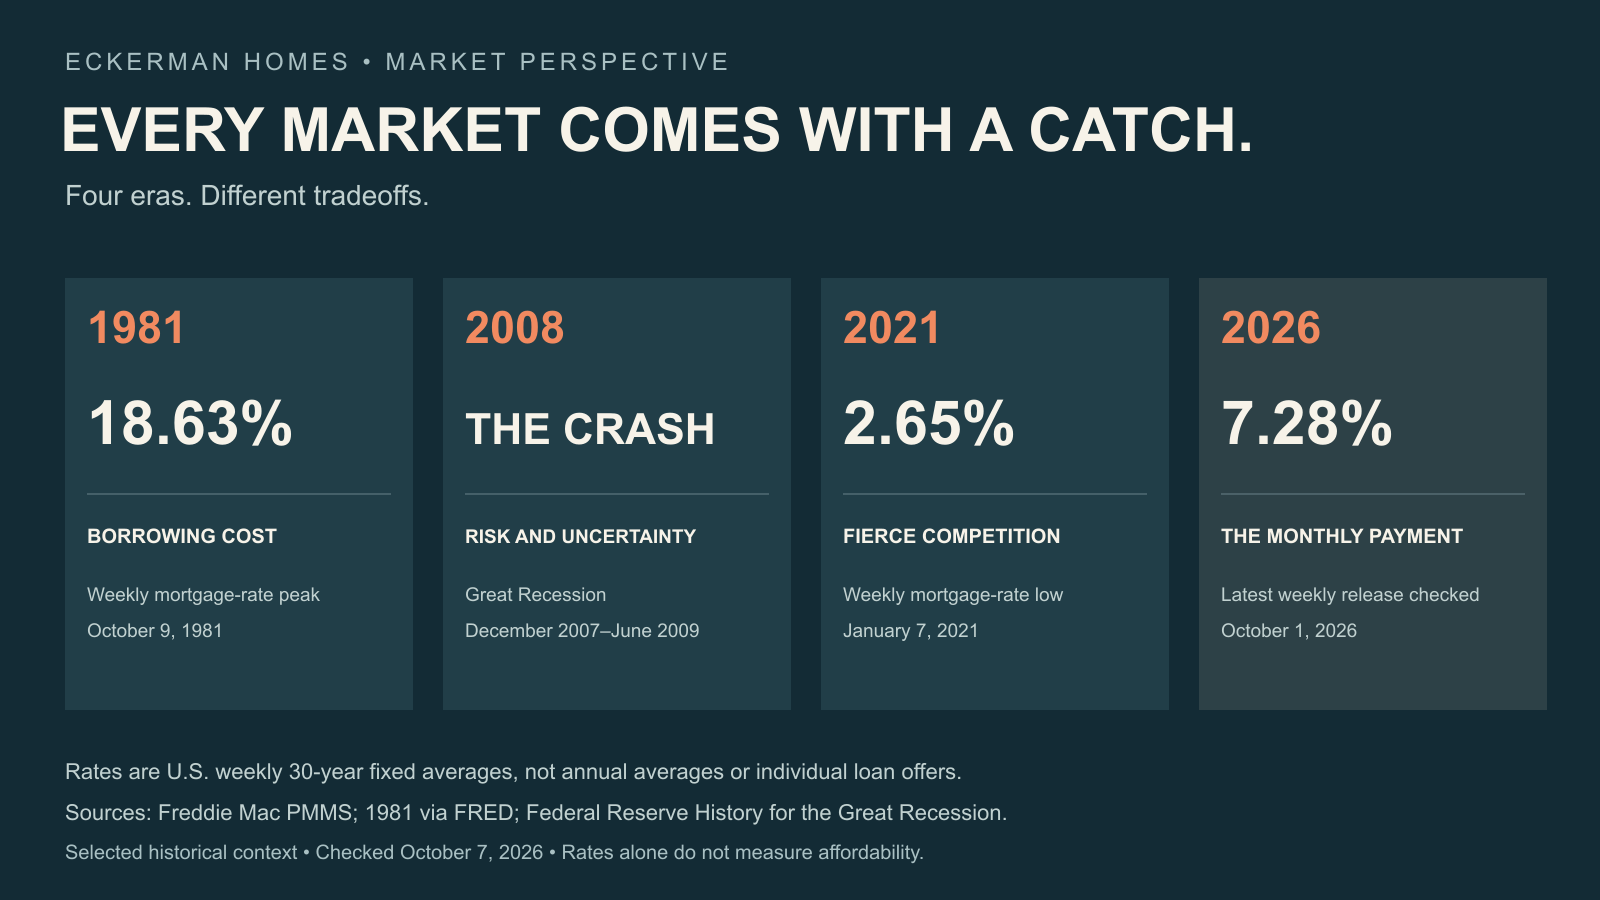
Mortgage figures are national weekly averages from Freddie Mac. The history and sources are explained below.
1981: The house cost less. The money didn’t.
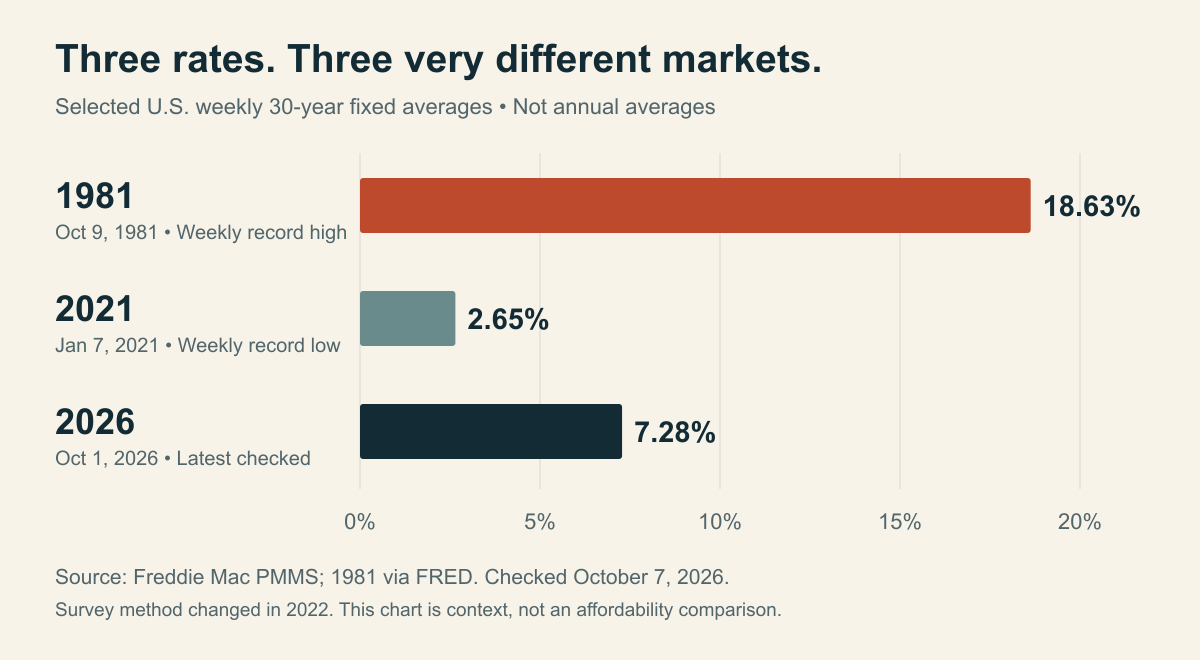
On October 9, 1981, the national weekly average for a 30-year fixed mortgage reached 18.63% in Freddie Mac’s survey. That is a weekly peak, not the average for the entire year. Freddie Mac historical rates via FRED
It is tempting to answer, “Sure, but houses were cheaper.” In dollar terms, yes. But a lower price tag does not settle the affordability question. Income, the amount borrowed, and the cost of borrowing belong in the same conversation.
And telling a buyer today that rates used to be 18% does exactly nothing to make their current payment smaller. Historical perspective is useful. Dismissing someone’s budget is not.
2008: A cheaper house came with a harder question.
The Great Recession ran from December 2007 through June 2009. Federal Reserve History describes an approximately 30% average decline in home prices from their mid-2006 peak to mid-2009, alongside a sharp rise in unemployment. That is national history, not a claim that every Northern Michigan home lost 30%. Federal Reserve History — The Great Recession
From this side of the chart, buying after a crash can look obvious. From inside it, you have to wonder whether your job will survive, whether financing will be available, and whether the price will fall again after you close.
People who lost homes or had to sell at the wrong time paid a real price. “You should have bought then” skips over that.
The opportunities that look obvious years later rarely feel obvious while you’re standing in them.
2021: Cheap money. Expensive competition.
Freddie Mac’s 30-year fixed average reached a survey record low of 2.65% on January 7, 2021. The release reported an average 0.7 point as well; the rate was never the whole cost of the loan. Freddie Mac — January 7, 2021 release
Then came the other side of the bargain. Redfin reported that 56.5% of homes sold above list price in June 2021 across its U.S. housing dataset. The median time on market for homes that sold was just 15 days in both June and July. Redfin — 10 Housing Records Set in 2021
A wonderful rate was not much help if you could not get a house under contract at a price and on terms you could live with. “Bring back 2021” sounds different depending on which side of the table you were sitting on.
2026: The payment still gets a vote.
As of October 1, 2026, Freddie Mac’s national 30-year fixed average was 7.28%. That is the latest published weekly release checked for this article, not a quote for your loan. Freddie Mac — Primary Mortgage Market Survey
Here is what that difference looks like without pretending a house today costs what it did in 2021. Hold the loan at $400,000 and the term at 30 years. At 2.65%, monthly principal and interest is about $1,612. At 7.28%, it is about $2,737. That is roughly $1,125 more each month before taxes, insurance, association dues, or maintenance.
Same loan. Different payment.
$400,000 borrowed for 30 years: $1,612/month at 2.65% versus $2,737/month at 7.28%. Difference: about $1,125/month.
A seller concession or a lower purchase price may help. It still has to help enough. Buying only works if the full cost fits your budget now. A future refinance might be useful if rates fall and you qualify. It is a possibility, not the foundation of a sound purchase.
Bring it home to Petoskey.
Realtor.com’s September 2026 Petoskey report lists 222 active listings, 54 median days on market, and a $689,450 median asking price. Active inventory was 8.23% higher than a year earlier. The site classifies Petoskey as a buyer’s market for that month. Realtor.com — Petoskey market overview
That suggests more choice than a year ago. It does not mean every listing is negotiable, or that 54 days is a promise about how long your home will take to sell. In fact, Petoskey’s reported median days on market was 1.67% lower than a year earlier. A market can offer more inventory without every measure slowing down. Realtor.com — Petoskey market overview
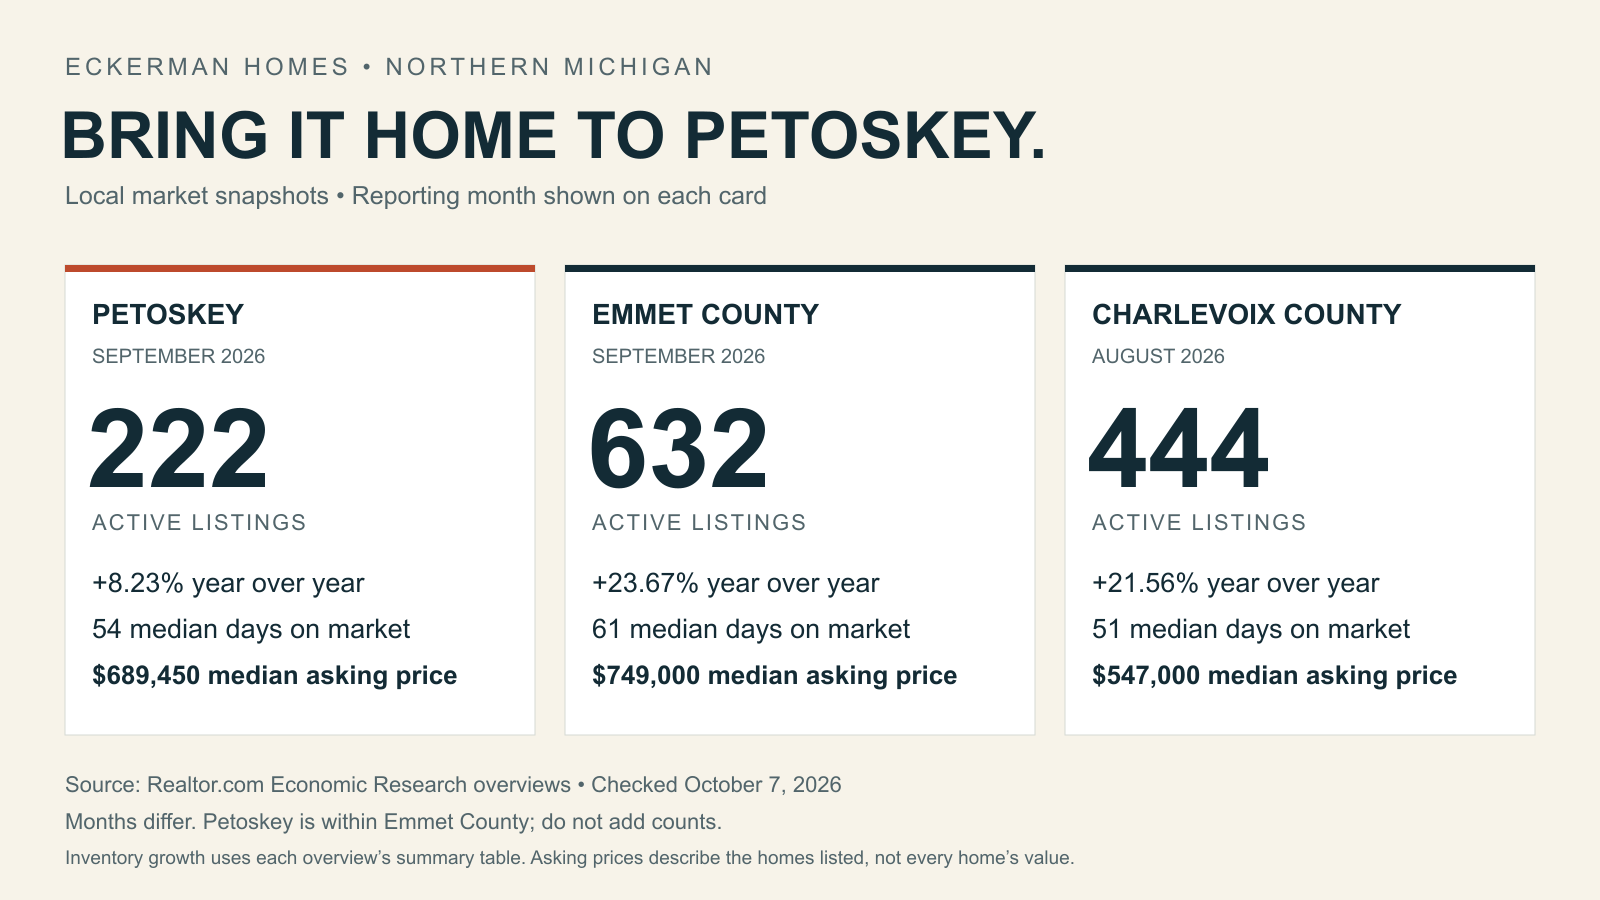
Latest dated portal overviews checked October 7, 2026. Petoskey is within Emmet County; counts overlap and must not be added. Charlevoix reports an earlier month. Portal figures cover broader residential listing mixes, not a matched set of comparable homes. Realtor.com Economic Research definitions.
For context, Emmet County’s September report shows 632 active listings, up 23.67% year over year, and 61 median days on market. Charlevoix County’s latest overview checked still covers August: 444 active listings, up 21.56%, and 51 median days on market. Those are separate geographies and reporting periods, not one regional average. Realtor.com — Emmet County market overview Realtor.com — Charlevoix County market overview
There is also direct local MLS evidence that more supply does not automatically mean demand disappeared. The Emmet Association of REALTORS’ July report shows 193 residential sales across its Total MLS coverage, compared with 165 in July 2025. Units on market rose from 718 to 916. That is about 17% more sales alongside about 28% more inventory. Emmet Association of REALTORS — residential statistics
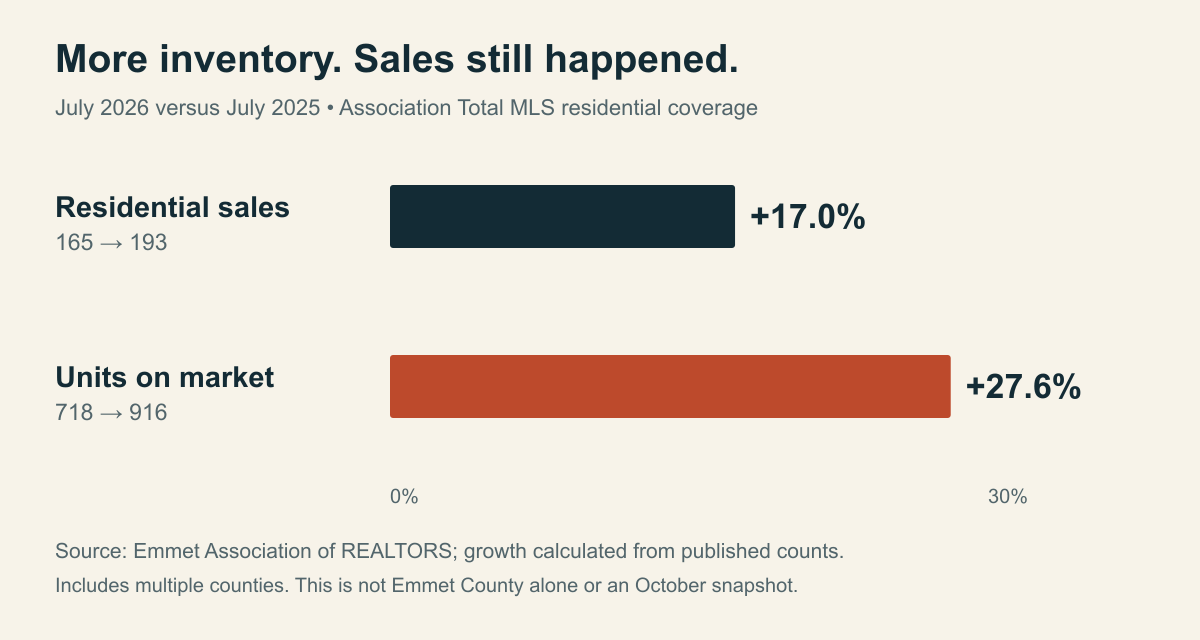
The July association report and the later portal reports measure different things. Together, they give us useful context. They do not turn all of Northern Michigan into one market. A waterfront property, an in-town house, a resort condo, and a home needing a new roof face different competition.
Buyers: Be patient with the search. Be strict with the numbers.
More choice is useful when you use it to compare real alternatives. Look at condition, total ownership cost, and recent sales of genuinely similar homes. A price reduction does not automatically make something a bargain. Neither does being on the market for two months.
Where the property’s competition supports it, ask about inspection terms, repairs, closing costs, or price. Keep enough money for the problems you have not found yet. Walk away if the payment requires everything in your life to go perfectly.
You do not win by buying sooner. You win by making a purchase you can live with.
Sellers: The market doesn’t owe you your price.
What you need to net matters to your decision. What buyers can purchase instead matters to your price.
Start with comparable closed sales and the homes competing for the same buyer today. Make the condition clear. Fix the presentation problems you can fix. Then pay attention to qualified showings, repeat visits, feedback, and offers.
A good marketing plan gets the property understood. It cannot make an unsupported price make sense. If the response is weak, examine price and condition alongside presentation. Waiting longer is not a strategy by itself.
Sometimes waiting is the right move.
If your income is uncertain, your cash reserve is thin, or a move would force you into a payment you resent every month, waiting can be a good decision. So can keeping a home that still works for you and has an affordable loan.
Give the wait a purpose. Build the reserve. Reduce debt. Get clarity on where you want to live. Set a payment limit and a review date. “I’ll reassess in six months with a stronger down payment” is a plan. “I’ll move when everything feels normal” has no finish line.
Stop waiting for normal. Start defining a good decision.
Housing has stable stretches. It still rarely delivers low rates, low prices, unlimited choice, and easy negotiation to everyone at the same time. Someone is usually giving something up.
You do not have to predict the next perfect window. You need a reason to move, numbers that hold up, and a property that fits. Sometimes that leads to an offer. Sometimes it leads to staying put.
You don’t need the perfect market. You need the right decision.
Thinking about a move in Petoskey or Northern Michigan? Bring me your timeline and the numbers you are trying to make work. We can look at the actual options, including whether waiting makes sense.
About the numbers
Checked October 7, 2026. Historical rates and crisis figures are national. Local MLS and portal reports have different coverage and dates. Active listings, closed sales, and asking prices measure different things. Median asking prices describe the homes offered for sale; they are not the value of every home in that area. Portal sale counts are not supplied in the summary tables, and small or changing sales mixes can move medians. Days on market is the portal’s listing-duration measure, not simply time to an accepted offer. Figures may be revised. Read the Realtor.com Economic Research data definitions.
Payment examples are the author’s calculations using standard fixed-rate amortization, with no assumed refinance or future price growth.
